
Page 60 - Full Book_24.4.2021
P. 60
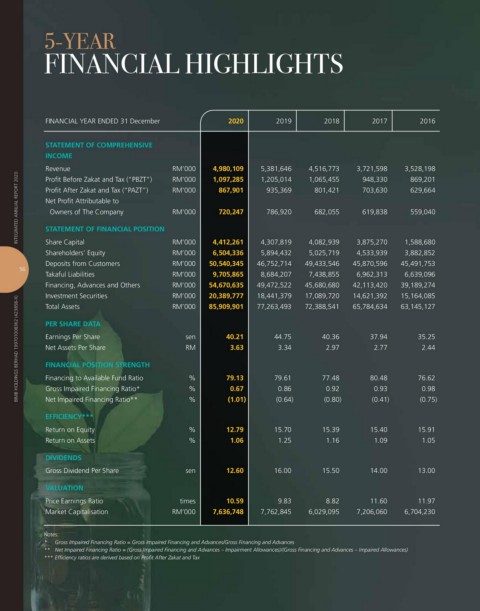
5-Year

            Financial HigHligHts


             FINANCIAL YEAR ENDED 31 December               2020         2019        2018         2017        2016


             STATEMENT OF COMPREHENSIVE
             INCOME
             Revenue                          RM’000    4,980,109    5,381,646    4,516,773    3,721,598    3,528,198
     INTEGRATED ANNUAL REPORT 2020  Profit After Zakat and Tax (“PAZT”)   RM’000    867,901   935,369  801,421  703,630  629,664
                                                        1,097,285
                                              RM’000
             Profit Before Zakat and Tax (“PBZT”)
                                                                     1,205,014
                                                                                 1,065,455
                                                                                               948,330
                                                                                                            869,201
             Net Profit Attributable to
                                                                                               619,838
                                                          720,247
                                                                                                            559,040
                                                                      786,920
              Owners of The Company
                                              RM’000
                                                                                   682,055
             STATEMENT OF FINANCIAL POSITION
             Share Capital
                                                                                                          3,882,852
                                                                     5,894,432
                                                        6,504,336
                                              RM’000
                                                                                 5,025,719
                                                                                              4,533,939
             Shareholders’ Equity             RM’000     4,412,261   4,307,819   4,082,939    3,875,270   1,588,680
             Deposits from Customers          RM’000    50,540,345    46,752,714    49,433,546    45,870,596    45,491,753
      56
             Takaful Liabilities              RM’000    9,705,865    8,684,207   7,438,855    6,962,313   6,639,096
             Financing, Advances and Others    RM’000    54,670,635    49,472,522    45,680,680    42,113,420    39,189,274
             Investment Securities            RM’000    20,389,777    18,441,379    17,089,720    14,621,392    15,164,085
     BIMB HOLDINGS BERHAD 199701008362 (423858-X)  PER SHARE DATA   sen    40.21   44.75  40.36  37.94        35.25
                                                                    77,263,493
                                              RM’000
                                                       85,909,901
                                                                                72,388,541
                                                                                                         63,145,127
             Total Assets
                                                                                             65,784,634
             Earnings Per Share
                                                                                                               2.44
                                                             3.63
                                                                                      2.97
                                                                         3.34
                                                                                                  2.77
             Net Assets Per Share
                                                 RM
             FINANCIAL POSITION STRENGTH
                                                  %
                                                                                                              76.62
                                                                                     77.48
                                                                        79.61
                                                                                                 80.48
             Financing to Available Fund Ratio
                                                            79.13
                                                                                                  0.93
                                                                                      0.92
             Gross Impaired Financing Ratio*
                                                             0.67
                                                                         0.86
                                                                                                               0.98
             Net Impaired Financing Ratio**
                                                  %
             EFFICIENCY***                        %         (1.01)       (0.64)      (0.80)       (0.41)      (0.75)
             Return on Equity                     %         12.79       15.70        15.39       15.40        15.91
             Return on Assets                     %          1.06        1.25         1.16        1.09         1.05
             DIVIDENDS
             Gross Dividend Per Share            sen        12.60       16.00        15.50       14.00        13.00
             VALUATION
             Price Earnings Ratio               times       10.59        9.83         8.82       11.60        11.97
             Market Capitalisation            RM’000    7,636,748    7,762,845   6,029,095    7,206,060   6,704,230
            Notes:
            *   Gross Impaired Financing Ratio = Gross Impaired Financing and Advances/Gross Financing and Advances
            **  Net Impaired Financing Ratio = (Gross Impaired Financing and Advances – Impairment Allowances)/(Gross Financing and Advances – Impaired Allowances)
            *** Efficiency ratios are derived based on Profit After Zakat and Tax